Nauka o drewnie
Sawmill yield and recovery: a complete guide
What volume yield, value yield and recovery factors mean, which log and process factors drive them (diameter, taper, sweep, kerf, patterns, edging, variation), what open sources show for Europe and North America, and how to measure, benchmark and improve.
Kraj / region badania lub danych: Europe (Nordics, Germany, Poland, Austria) and North America
Why yield is the number that decides a sawmill's economics
In most sawmills the logs are the largest single cost. A mill that turns a larger share of every cubic metre of logs into saleable boards, or into more valuable boards, earns more from the same wood supply without buying more wood. That is why "yield" and "recovery" appear on every mill manager's dashboard, and also why the terms are used loosely and the numbers are often compared unfairly.
This guide explains what yield and recovery measure, which factors move them, what open sources show for Europe and North America, and how a mill can measure, benchmark and improve its figures. Every figure comes from a source we opened, with its region and study conditions given. Our own arithmetic is labelled, and points we could not verify are said so.
One warning applies to the entire article: there is no single "typical" recovery for spruce or pine. Published numbers differ by definition (green rough, dried, planed), by log size, by product mix and by whether logs are measured over or under bark. A figure of 50 percent from one study and 72 percent from another can both be correct and still not be comparable.
Definitions: volume yield, value yield and the many recovery measures
Volume yield
Volume yield (also called volume recovery or conversion efficiency) is the sawn product volume divided by the log volume that produced it, usually written as a percentage:
volume yield (%) = sawn volume (m³) / log volume (m³) x 100
Three choices change the answer without any change in the mill's performance:
- State of the lumber. Rough green boards, kiln-dried rough boards and planed dry boards have different volumes. Drying shrinks the wood and planing removes material.
- How the log is measured. Over bark or under bark, with or without a top-end allowance, by a mid-diameter formula or by a scanner. This is a measurement convention, not a physical constant.
- What counts as a product. Some studies count only the main product (for example, centre boards), others count everything that is sawn and sold as lumber.
The FAO, ITTO and UNECE joint publication on forest product conversion factors illustrates the first point with an example for construction softwood, rough green 1.57 m³ of roundwood per m³ of sawnwood (64 percent recovery), rough dry 1.63 (62 percent) and "sawnwood shipped" 2.08 (48 percent). The source describes this as an illustrative example, not country data (FAO, ITTO and UNECE 2020; the figure was taken from the document as extracted, and the 2.08 value should be checked against the original table before reuse).
Inverse measures: the conversion factor
Statisticians often use the reciprocal, the conversion factor: cubic metres of roundwood per cubic metre of sawnwood. The FAO, ITTO and UNECE publication reports 1.59 for coniferous sawnwood in Germany (Europe) and 2.04 for the United States (North America), which our inverse turns into roughly 63 and 49 percent. National factors depend on log measurement and lumber state, and the extract we opened did not give the basis of each, so the gap is not a performance ranking.
North American measures: overrun, LRF and CLR
North American mills, especially in the West, have historically used board-foot log rules such as Scribner. This produced a family of measures that are unfamiliar in Europe:
- Lumber overrun (LO): the lumber tally in board feet minus the log-rule volume, divided by the log-rule volume, expressed as a percentage.
- Lumber recovery factor (LRF): board feet of lumber tally per cubic foot of log (bole) volume.
- Cubic lumber recovery (CLR): cubic volume of green lumber divided by cubic volume of logs processed.
Keegan and colleagues (2010), analysing western United States mills, argue that overrun is imprecise because it depends on a log rule that does not reflect real solid-wood volume; LRF and CLR, based on cubic volume, are more reliable. A CLR of 0.50 means 50 percent in green lumber terms.
Value yield
Value yield asks a different question: how much money does a cubic metre of logs produce? It can be written as:
value yield (currency per m³ of log) = (revenue from lumber + revenue from by-products) / log volume
or, if the cost of conversion matters, net of processing costs. Value yield rewards sawing patterns that produce wider, longer or higher-grade boards, even when this lowers the volume yield. It also rewards a good by-product strategy, since chips, sawdust and bark have their own markets or internal uses. The two goals can conflict. A mill that rotates each log to keep knots out of the highest-grade boards can raise value while the volume yield stays nearly unchanged or even falls.
How much wood becomes lumber: the physical balance
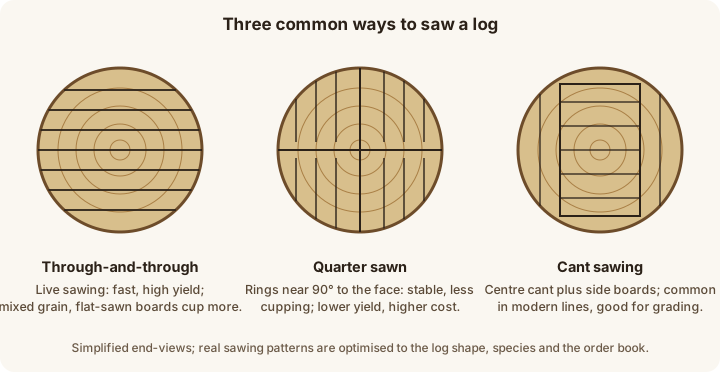
A sawmill is a conversion line in which the round log becomes a collection of rectangular pieces plus residues. The rectangular products fit inside a round, tapered, imperfect cylinder. Whatever is outside the best-fitting rectangles is residue. Three streams leave the saw line:
- Primary product: boards, planks, scantlings and cants.
- Solid residues: slabs, edgings, trim ends. Usually chipped and sold to the pulp, panel or energy markets.
- Sawdust and bark: produced by the saw kerf and by debarking.
Only one open source we examined gives a simple mass balance. A worked example in an FAO document (T0269E, Appendix VI) takes net log input as 100 percent: bark about 12 percent of gross input, slabs, edgings and trimmings 34, sawdust 12, air-dried lumber 52 after 2 percent shrinkage, and finished kiln-dried lumber 40 after further shrinkage and 8 percent planer shavings, sawdust and trim ends. It does not specify mill type or region, so it is a generic textbook example, not a benchmark for spruce and pine mills.
A more specific European estimate comes from a simulation by Kantola (2008) for Norway spruce in southern Finland (Europe). Sawing results for three thinning regimes were produced with a stem-and-sawing simulator following Finnish industrial practice. From the reported table we calculated the following ratios (our calculations from the published volumes per hectare):
| Thinning regime | Sawn timber / log volume | Sawmill chips / log volume | Sawdust / log volume |
|---|---|---|---|
| Unthinned | about 53% (289 of 545 m³/ha) | about 28% (152) | about 15% (83) |
| Normal | about 54% (314 of 584) | about 27% (159) | about 15% (89) |
| Intensive | about 54% (299 of 556) | about 28% (154) | about 15% (81) |
The three streams add to roughly 96 percent of log volume; the source does not explain the rest. The order of magnitude is the point: in this simulated Finnish case a little over half of the log leaves as sawn timber, a little over a quarter as chips and about one-seventh as sawdust. The data come from one stand and a simulator, not from mill measurements.
Factors that determine recovery
Steele (1984), writing for the USDA Forest Products Laboratory (North America), listed seven interacting factors: log diameter, length, taper and quality; kerf width; sawing variation and rough green size; product mix; operator decisions; equipment condition; and sawing method. Although the report is old, it remains one of the clearest open treatments of the subject, and later studies cited below are consistent with its structure. We follow it here and add more recent evidence where we found it.
Log diameter and the small-log penalty
In a simulation of Swedish spruce and pine (Fredriksson et al. 2015; Europe), the reference cant-sawing process gave a planed-board yield of 43.7 percent of log volume for all logs but only 35.8 percent for the 2,214 logs with top diameter under 185 mm, about eight points lower (our subtraction). How the small logs are sawn changes this substantially, as discussed below.
Taper
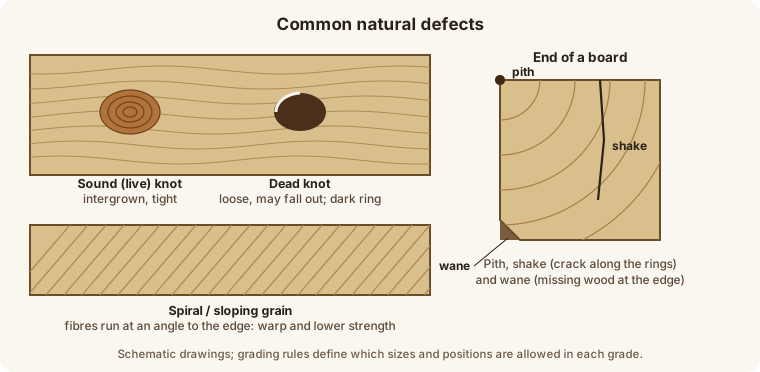
Taper is the decrease in diameter along the log. A cylinder yields rectangular boards of the full log length from one cut; a tapered log loses wood because the boards must fit inside the narrow end. Steele (1984) notes that taper lowers recovery and argues that log length by itself has no direct effect, because the apparent length effect comes from the increased taper in longer logs.
A BOKU conference presentation on Austrian coniferous sawlogs (Blinzer and Treml 2022; Europe) gives a clear worked example. For a glued-laminated timber lamella 43 x 146 x 4,000 mm, sawn by a three-stem sawing pattern, the main-product yield falls as taper increases:
| Taper (mm over log length) | Mid diameter (cm) | Log volume (m³) | Sawn volume (m³) | Main-product yield |
|---|---|---|---|---|
| 5 | 22 | 0.152 | 0.075 | 49% |
| 10 | 23 | 0.166 | 0.075 | 45% |
| 15 | 24 | 0.181 | 0.075 | 41% |
| 20 | 25 | 0.196 | 0.075 | 38% |
| 25 | 26 | 0.212 | 0.075 | 35% |
Sweep and crook
Sweep (a gradual bend) and crook (a sharp local bend) force straight saw lines to cut across the grain-following shape of the log. The consequences are shorter pieces, more edging waste and lower grade. Open evidence on this comes mainly from North America and mainly from hardwoods:
- Hamner and colleagues (2006) compared straight sawing with curve sawing of small-diameter hardwood logs in the United States (North America, mixed hardwoods). Overall lumber yield was 62 percent for curve sawing against 58 percent for straight sawing. For logs with only slight sweep (0 to 15 percent sweep deduction) there was no difference, 62 percent for both. For the 16 to 30 percent group the figures were 54 and 64 percent, and for logs above 30 percent 48 and 60 percent. The authors conclude that yield can be as much as 10 to 12 percent higher when curve sawing sweepy hardwood logs. The sample was 134 logs.
- Maness and Donald (1994) studied 834 spruce-pine-fir logs from interior British Columbia (North America) and found that sweep and cross-sectional eccentricity both significantly reduced value recovery, and that rotating each log into its own best position gave significant benefits, more strongly linked to eccentricity than to sweep.
For spruce and pine in Europe we did not find an open source that quantifies the loss from sweep in the same way. A Skogforsk report on stem models (Moberg, Hannrup and Norell 2005; Sweden, Europe) makes a related point: assuming a circular cross section would over-estimate lumber volume recovery, which is why the authors developed models for taper and for the ellipticity of the stem. The report does not give recovery numbers.
A harvester-data study from Estonia (Padari and Kangur 2023; Europe, the country is inferred from the authors' affiliation) provides an upstream view. Comparing assortment yields with straight undamaged trees, damaged or deformed stems showed a reduction in sawlog volume of 7 to 28 percent for Scots pine and 5 to 30 percent for Norway spruce, depending on site and age. These are shifts in the assortment, not sawmill recovery, but they show that crooked or defective stems can lower the share of the stem that even reaches the sawmill as a sawlog.
Stem to sawlog: the loss before the mill
Recovery is often calculated from the log yard gate, but the yield from the standing tree is lower. Brandstetter and colleagues (2020) followed eight silver fir stems in Romania (Europe): crosscutting lost on average 11 percent of stem volume, sawlog grading 7 percent and debarking 6 percent, leaving 76 percent as debarked sawlogs (range 67 to 85 percent). The manual felling cut, which removed the largest-diameter butt section, was the main cause of the crosscutting loss. The sample is small and no sawing was done, but it shows why the measurement basis must be agreed before benchmarks are compared.
Kerf and saw type
Kerf is the saw plate thickness plus the set of the teeth, and every saw line turns that strip into sawdust. Steele (1984) cites a 1962 study in which cutting kerf from 12/32 to 9/32 inch raised board-foot yield by an average of 7 percent for logs 5.5 to 12 inches in diameter (North America). In his worked example an 8.3-inch, 16-foot log gained 8.3 percent when kerf fell from 0.240 to 0.180 inch, not from an extra board but from a pattern change that allowed wider lumber; a 10.1-inch log gained 4 percent through longer boards. Kerf savings are therefore discontinuous: they show up when they tip the log into a better pattern.
The Polish pine study (Wieruszewski et al. 2023; Europe) compared a horizontal band saw with a vertical frame saw. Tables give mean yields of about 72.8 and 71.8 percent; the text gives 72.6 and 69.7 and the abstract 72 and 69, so the paper is not internally consistent. It lists a 2.2 mm frame saw plate with 0.9 mm set per side and a 1.0 mm band saw plate with 0.75 mm set per side, i.e. cut widths of roughly 4.0 and 2.5 mm if set is counted on both sides (our calculation, dependent on the authors' definition). The difference was not statistically significant, but with six logs the test had little power; a small sample cannot show the kerf effect.
Sawing variation and target size
Sawing variation is the scatter in the thickness of boards cut with the same setting, caused by saw wander, vibration, feed problems and worn guides. Because planing needs a minimum green size to reach the final dimension, mills add an oversizing allowance proportional to variation. Steele (1984) cites Stern and colleagues (1979), who estimated that improving sawing accuracy from 0.2 to 0.1 inch on a machine with a 0.125-inch kerf would raise board-foot yield by 6.0 percent (North America, estimate). He also points out that planing allowances are often excessive and can usually be reduced.
The Alaska study by Kilborn (2002; North America) is among the best open demonstrations. Across 23 studies at 22 mills with 1,666 straight, sound logs, board thickness variation exceeded the industry standard of 0.030 inch in 17 studies and oversizing was a problem in 18; the three most efficient mills were at 0.020 inch or below. He estimated roughly 2.5 percent more recovery for each 0.030 inch (about 0.76 mm, our conversion) removed from product thickness. His recommendations: reduce target thickness, align and maintain equipment, and run a quality control program, even weekly or monthly. The effect size on a modern high-speed European line may differ; we found no open European measurement to compare.
Sawing pattern and opening face
Sawing pattern is the choice of how the log is divided into cants, centre boards and side boards. Steele (1984) quotes Hallock and Lewis (1973): shifting the opening face by 0.2 inch on an 8-inch log can change recovery by 25 percent, and for logs of 5 to 20 inches the best opening face averaged 21 percent above the worst (North America). He also reports that offset rather than centred sawing probably raises recovery by 5 to 10 percent, and that single softwood sawing methods ranged from 0.5 to 6.6 percent below the best mixed-method result. These are older simulation results and indicate order of magnitude only.
The Swedish CLT case (Fredriksson et al. 2015; Europe) shows that pattern interacts with product. Live sawing with trapeze edging of logs under 185 mm top diameter into 24 to 46.5 mm green boards for CLT layers gave 53.2 percent of log volume against 35.8 percent for the reference cant sawing, a gain of 17.4 points as stated by the authors. For the full log range the cant-based CLT process gave 42.8 against 43.7 percent, no gain. This is a simulation of two different products, and we matched yields to scenarios from a garbled table using the stated differences.
Edging and trimming
Product mix and operator decisions
Steele (1984) shows how adding a product to the mix can increase yield: on a 7.1-inch, 16-foot log, allowing 1 x 4 boards raised yield from 48 to 52-2/3 board feet, an increase of 9.7 percent (North America). More products give the optimiser more ways to fill the space. The corollary is that the best volume yield and the best value yield may use very different mixes, and that a mill with a narrow product range cannot reach the recovery of a more flexible competitor sawing the same logs.
Scanning and rotation: the value dimension
Rais and colleagues (2017) simulated industrial X-ray CT scanning of 36 Douglas-fir logs from southern Germany (Europe; not spruce or pine). Using the best rotation angle instead of the conventional horns-up position raised the average value of sawn products by 4, 8 and 20 percent under three price scenarios for strength grades. The paper reports no volume recovery for its own data. Volume stays nearly the same while pieces are placed where the best grades emerge, so we expect larger gains where grade price spreads are large (our interpretation).
Typical recovery ranges: what the open sources show
The table gathers every figure from the sources we opened that can reasonably be compared with a sawmill volume yield. It does not average them, because they do not share a definition.
| Region | Species and setting | Measure and result | Source and caveat |
|---|---|---|---|
| Europe (Germany) | Coniferous sawnwood, national factor | 1.59 m³ roundwood per m³ sawnwood, about 63% (our inverse) | FAO, ITTO, UNECE 2020; basis not verified |
| North America (USA) | Coniferous sawnwood, national factor | 2.04 m³ per m³, about 49% (our inverse) | FAO, ITTO, UNECE 2020; basis not verified |
| Europe (Finland) | Norway spruce, simulated, three thinning regimes | about 53 to 54% sawn / log volume (our ratio) | Kantola 2008; one stand, simulation |
| Europe (Sweden) | Spruce and pine, simulated cant sawing | 43.7% planed boards (all logs); 35.8% (logs under 185 mm top) | Fredriksson et al. 2015 |
| Europe (Sweden) | Same logs, live sawing for CLT | 53.2% (logs under 185 mm top) | Fredriksson et al. 2015; different product |
| Europe (Poland) | Scots pine, six large logs (375 to 435 mm mid diameter) | about 69 to 73% (band saw about 72.8%, frame saw about 71.8%) | Wieruszewski et al. 2023; tiny sample, inconsistent text |
| Europe (Austria) | Coniferous, glulam lamella, three-stem sawing | 49% down to 35% as taper rises from 5 to 25 mm | Blinzer and Treml 2022; main product only |
| Europe (Finland, historical) | Norway spruce and Scots pine, circular saws, data 1950 to 1951 | 63.9% of technical volume, centre-piece sawing | Granvik 1968; historical, not representative today |
| North America (western USA) | Mixed western softwoods, 2000 to 2006 | CLR 0.39 (Alaska) to 0.52 (Oregon); LRF 6.72 to 8.67 | Keegan et al. 2010 |
| North America (Alaska) | Mixed softwoods, straight sound logs, 1997 to 1999 | LRF average 6.38 (range 4.8 to 10.05) | Kilborn 2002 |
| North America (USA) | Mixed hardwoods | 58% straight sawing, 62% curve sawing | Hamner et al. 2006; hardwood, small logs |
Reading this table carefully:
- Nordic spruce and pine. The sources we opened give simulation or small-sample figures from the mid-30s to the mid-50s percent for mixed log sizes, depending strongly on log size and on whether the figure refers to planed or rough lumber. We found no open, mill-measured national average for Finland, Sweden or Norway. Luke reports 27.2 million m³ of roundwood used by Finnish sawmills in 2021 (Europe) and 8.7 million m³ of sawn goods exported, but not sawn goods production, so we compute no national yield.
- Germany and Poland. The only verified German figure is the FAO, ITTO and UNECE factor of 1.59 (about 63 percent). The Thünen reports we opened covered panel and pulp industries and sawnwood statistics, and gave no sawmill yield. For Poland there is no open figure for an industrial mill, only the six-log pine experiment.
- North America. The strongest open data are the Keegan series for the western United States. CLR rose in every state between the 1970s and 2000 to 2006, for example Oregon from 0.42 to 0.52, Washington 0.43 to 0.50, Idaho 0.40 to 0.46 and Alaska 0.36 to 0.39, with LRF rising in step (Oregon 7.04 to 8.67). The authors read this as better sawing despite smaller logs. Kilborn cites an estimated Pacific Northwest LRF of 9.0 in 2000 and a US average of 7.75 in 1979. These are western softwoods, not Nordic spruce and pine, and board-foot ratios depend on log-rule conventions.
How to measure yield in your own mill
A trustworthy yield number needs a clear definition, a representative sample and a method that does not hide errors. The following procedure is our synthesis based on the methods in the USDA studies cited (Kilborn 2002; Keegan et al. 2010) and on general practice; where a point is our recommendation rather than reported in a source, it is marked as such.
- Fix the definitions. Over or under bark, how diameter is measured, and whether lumber is counted rough green, dried or planed. Kilborn measured log volume by Smalian's formula and used LRF as the main comparison because it depends less on log diameter than a log rule.
- Choose the sample. To isolate the machine, use straight, sound logs of a defined size range, as Kilborn did (1,666 logs, excluding noticeable crook, sweep or decay). For overall performance use all logs over a defined period. The two answer different questions (our interpretation).
- Track logs through the line, recording dimensions, species and products per log. An input/output balance over a period is simpler but cannot show why yield changed.
- Measure the saw line. Measure thickness repeatedly along each board, as Kilborn did with calipers, within and between boards and top to bottom, to quantify sawing variation.
- Separate the effects. Report yield with log size distribution, product mix and by-product share; a drop may come from smaller logs, not worse sawing (our interpretation, supported by the eight-point small-log gap above).
- Report volume and value, with the price basis and date.
How to benchmark
Benchmarking against another mill is only meaningful if the following are comparable:
- the unit (volume yield, conversion factor, LRF, CLR) and the state of the lumber;
- the log size distribution and species mix;
- the product mix and the grade rules;
- the log measurement convention.
The North American practice of comparing LRF by region, with long time series, is a useful model. Keegan and colleagues compared eight states and regions over four periods, and Kilborn compared Alaskan regions to an estimated Pacific Northwest figure. In Europe, public benchmarking of sawmill yield by species and log class appears much rarer in the open literature that we could access (our observation, not a proven statement about industry practice). A mill should therefore build an internal benchmark first: the same procedure, repeated each quarter, with a log size class breakdown, so that improvements are visible against its own history.
How to improve recovery
The evidence reviewed above points to a short list of actions, ordered roughly by how directly the sources support them.
- Cut sawing variation and oversizing first. Kilborn (2002) found oversizing at 18 of 23 studies and variation above 0.030 inch at 17, and estimated about 2.5 percent more recovery per 0.030 inch removed; Steele's estimate for halving variation from 0.2 to 0.1 inch is 6.0 percent (North America). Remedies: saw maintenance, alignment, tighter adjustment points and routine quality control. Then revisit planing allowances, which Steele calls often excessive.
- Match pattern to log and product. The Swedish CLT case and the opening-face results show pattern can matter more than saw type. Shape-scanning optimisers choose patterns log by log.
- Position and rotate sweepy logs. Curve sawing gained up to 10 to 12 percent in sweepy hardwood; for straight spruce and pine logs the effect will be smaller (our interpretation). Rotation supports value (Maness and Donald; Rais et al.).
- Use thinner kerf where the line can hold it. Gains are real but discontinuous (Steele); thin saws need good guiding, or variation rises and the gain is lost (our interpretation).
- Widen the product mix and optimise edging. Steele reports 9.7 percent from adding one product on one log, and optimised edging 12.9 percent better than operators in one case.
- Weigh throughput against yield. Hermas and Krzosek (2020) argue with an illustrative mill that simpler patterns can raise annual output while high-yield patterns save logs. Their numbers are internally inconsistent and prices fictional, so we use only the idea: trade yield and throughput against log price.
- Look upstream and downstream. Pre-mill losses (Brandstetter et al. 2020; Padari and Kangur 2023) can matter as much as machine settings, and by-product outlets are part of value yield (our interpretation).
By-products and the whole-log view
Sawmills in Europe are an important source of fibre for other industries. In Germany (Europe), the Thünen Institute's raw material monitoring for 2021 reports that sawmill by-products supplied about 5.9 million solid cubic metres to the wood-based panel industry (37.1 percent of its fibre wood use) and about 3.98 million solid cubic metres to pulp producers, of which softwood by-products were 3.43 million solid cubic metres, 37.7 percent of the fibre wood those producers used. These figures show how interdependent the industries are: a change in sawmill output or in the sawing pattern affects panel and pulp supply. We cannot convert these flows into a sawmill yield, since the same reports do not provide the sawlog input or sawn output.
For Finland (Europe), Luke reports that 9.8 million m³ of sawmill chips and sawdust went into forest industry products in 2021, within 27.5 million m³ of forest industry by-products and residues, 17.3 million m³ of them used for energy. The figure may include non-sawmill sources. Bark share depends on whether logs are measured over or under bark; the generic FAO example above puts it at 12 percent of gross log input.
Sources used
Sources used
Limits of this article
- Not a benchmark table. Figures differ in definition, species, year and method. Do not average them or use them as a mill target.
- Simulations and small samples. The Finnish, Swedish and CT results are simulations; the Polish pine result rests on six logs and the Romanian on eight stems.
- North American data are not Nordic spruce and pine. The western US figures describe mixed western softwoods in board-foot conventions, and the Hamner et al. results concern small hardwood logs.
- Old studies. Steele (1984) and the work it cites date from the 1960s to 1980s; the Granvik data are from 1950 and 1951.
- Gaps in open European data. We found no open, mill-measured national average yield for spruce or pine in Finland, Sweden, Norway, Germany or Poland, and did not compute national yields. Eurostat and Skogforsk national benchmarks were not found in verifiable form.
- Own calculations. Inverse factors (1/1.59, 1/2.04), the Finnish ratios, the 14-point taper drop, the 0.76 mm conversion and the kerf sums are ours.
- Source quality. Some tables were garbled in text extraction (the Swedish CLT paper, the FAO conversion table); the Polish and Hermas and Krzosek papers contain inconsistencies. Treat these as indications.
- Not covered. Hardwood sawing in detail, drying, planing and sorting losses, tropical species, portable mills and investment economics.
- Not advice. The improvement list is a synthesis and our interpretation; test changes under your own conditions.
Sources used
The full source list with links is in the article metadata. Main sources: Steele (1984, USDA FPL, North America); Keegan et al. (2010, USDA, North America); Kilborn (2002, USDA, North America); FAO, ITTO and UNECE (2020); Kantola (2008, Finland); Fredriksson et al. (2015, Sweden); Wieruszewski et al. (2023, Poland); Blinzer and Treml (2022, Austria); Brandstetter et al. (2020, Romania); Rais et al. (2017, Germany); Hamner et al. (2006) and Maness and Donald (1994, North America); Thünen Working Papers 87, 245 and 253; Luke statistics for Finland.
Jak sprawdzono ten tekst · sprawdzono 2026-10-26
Each cited figure was read from the opened source page or PDF via fetch; own calculations labelled in text; unreadable or inconsistent items listed as unverified.
Nie udało się zweryfikować
- Basis (log measurement, lumber state) of the FAO/ITTO/UNECE national factors for Germany (1.59) and USA (2.04) not verified; FAO illustrative 2.08 value read from an extract with scrambled columns
- No open mill-measured national average sawmill yield found for Finland, Sweden, Norway, Germany or Poland (Thuenen WP 245/253/87 and Luke pages had no sawmill yield or sawn production)
- FAO T0269E Appendix VI residue example: year, mill type and region not stated
- Remaining ~4% of log volume in Kantola simulation (sawn+chips+sawdust ~96%) unexplained in source
- Kerf sums (4.0 mm / 2.5 mm) depend on interpretation of 'set per side' in the Polish paper, which also has internally inconsistent yield values
- Estonia as country of Padari & Kangur inferred from author affiliation
- Swedish CLT yield-scenario matching reconstructed from garbled table using stated differences
- Hermas & Krzosek economics internally inconsistent; used only for the concept
- Statement that European public benchmarking of sawmill yield is rare is an observation from limited search, not verified
- Granvik 1968 country (Finland) inferred from journal and language; species-specific yields not extracted
- Steele 1984 and cited 1962-1982 studies are old; modern transferability not verified
Źródła
- Steele 1984, Factors Determining Lumber Recovery in Sawmilling, USDA FPL GTR-39
- Keegan et al. 2010, Trends in lumber processing in the western United States, Part II: Overrun and lumber recovery factors (Forest Products Journal 60(2))
- Keegan et al. 2010, full text (Forest Products Journal 60(2):140-143)
- Kilborn 2002, Lumber Recovery Studies of Alaska Sawmills 1997-1999, PNW-GTR-544
- FAO, ITTO, UNECE 2020, Forest product conversion factors
- FAO, Appendix VI Generation of wood residues (T0269E)
- Kantola 2008, Structure of Norway spruce stems in relation to wood properties of sawn timber, Dissertationes Forestales 70
- Fredriksson et al. 2015, Using Small Diameter Logs for Cross-Laminated Timber Production, BioResources 10(1)
- Moberg, Hannrup, Norell 2005, Models of stem taper and cross-sectional eccentricity for Norway spruce and Scots pine, Skogforsk
- Granvik 1968, Sawing yield in sawing coniferous logs with circular saw, Acta Forestalia Fennica 86
- Wieruszewski et al. 2023, Influence of pine wood sawing technology on material efficiency indicators, Annals WULS-SGGW 122
- Hermas, Krzosek 2020, Produktionsoutput versus Ausbeute, Annals WULS-SGGW 109
- Blinzer, Treml 2022, Nadelsaegerundholz - Fundament der Forstwirtschaft, BOKU Forstoekonomische Tagung
- Brandstetter et al. 2020, Conversion Efficiency of Fir Roundwood into Sawlogs, BioResources 15(3)
- Padari, Kangur 2023, Validation of saw log and technological wood assortment recovery predictions, Forestry Studies 79(1)
- Rais et al. 2017, First industrial X-ray CT scanner increases lumber recovery value, Annals of Forest Science 74:28
- Hamner, White, Araman 2006, Curve sawing two-sided cants from small-diameter hardwood sawlogs, Forest Products Journal 56(10)
- Maness, Donald 1994, Effect of Log Rotation on Value Recovery in Chip and Saw Sawmills, Wood and Fiber Science
- Thuenen Working Paper 253, Holzstoff- und Zellstoffindustrie 2021 (Rohstoffmonitoring Holz)
- Thuenen Working Paper 245, Holzwerkstoffindustrie 2021 (Rohstoffmonitoring Holz)
- Thuenen Working Paper 87, Analyse der Abweichung empirischer und amtlicher Meldungen zur Produktionsmenge von Schnittholz
- Luke, Wood consumption 2021 (provisional)
- Luke, Paperboard became the most important exported forest industry product (2021 exports)
Ostatnia aktualizacja: 2026-10-26