Wood science
Strength grading of sawn timber in Europe: visual rules, machines and EN 338 classes
How European sawmills turn variable boards into EN 338 strength classes: EN 14081 and EN 1912, characteristic values, DIN 4074, INSTA 142 and Polish rules, dynamic MOE, laser and X-ray indicators, yields for spruce and pine, FPC and CE marking.
Country / region of the study or data: Europe
Why sawn timber is graded at all
A sawmill that sells structural timber is not really selling wood. It is selling a predictable mechanical property. A designer who specifies a floor joist, a rafter or a truss chord needs to know that the piece will carry its design load, and the only way to give that assurance across millions of boards is to sort the output into groups whose properties are known statistically. That sorting is strength grading.
Two facts shape everything that follows. First, wood is highly variable within and between sources; the Gradewood data discussed below show national mean bending strengths of spruce differing by several MPa before any within-sample scatter is considered. Second, strength cannot be measured on the board you are going to sell, because the only way to measure it is to break it. Grading therefore works by measuring something non-destructive and correlating it, statistically, with strength. The Edinburgh Napier overview of UK practice puts the principle plainly: timber is sorted into grades according to a non-destructive assessment, and the characteristic properties of each grade then set the strength class (Ridley-Ellis, 2018). The assessment can be done by a trained person looking at the board (visual grading) or by a machine measuring physical signals (machine grading).
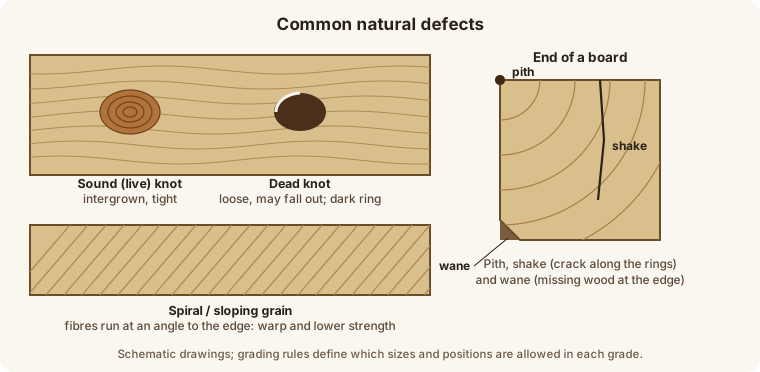
The diagram above is intended to illustrate log-level features that later become board-level grade-reducing features, such as knots, sloping grain around them, pith and wane.
The standards architecture: EN 14081, EN 338, EN 384 and EN 1912
European structural grading rests on a small family of standards that each do a different job.
EN 14081-1 is the harmonised product standard. Its publisher preview describes the scope as strength-graded structural timber with rectangular cross-sections, graded either visually or by machine, with dimensions complying with EN 336 and with the timber "shaped by sawing, planing or other methods". The scope excludes fire-retardant-treated timber and finger-jointed timber. The standard includes provisions for test methods, assessment and verification of constancy of performance, and marking, and it identifies the characteristics for which limits must be given in visual grading standards (iTeh preview of SIST EN 14081-1:2016). The preview's table of contents shows Annex A (limits for strength-reducing characteristics in visual grading standards), Annex B (species marking codes), Annex C (moisture content measurement) and Annex ZA, which links the standard to the EU Construction Products Regulation and therefore to CE marking.
EN 14081-2, -3 and -4 deal with machine grading. According to Stapel's doctoral thesis, EN 14081-1 is the harmonised standard for strength grading of rectangular structural timber, while parts 2 to 4 cover machine grading (Stapel, 2014). The iTeh preview adds that type testing is in EN 14081-2 and factory production control in EN 14081-3. The Silesian pine paper cites EN 14081-4:2009 for machine settings of machine-controlled systems, and the Napier overview notes that EN 14081-4:2009 has since been withdrawn, with settings now approved through a task group process (see the machine-grading section).
EN 338 is the strength class system. Its scope, as quoted in the iTeh preview, is to establish "a system of strength classes for general use in design codes" and to give characteristic strength, stiffness and density values for each class to which EN 14081-1 refers. It applies to softwood and hardwood timber for structural use within the scope of EN 14081-1. The preview's introduction says a strength class system groups together grades, species and sources with similar strength properties so that they can be used interchangeably (iTeh preview of SIST EN 338:2016).
EN 1912 is the bridge between national visual grades and EN 338 classes. The Swedish standards body describes the 2024 edition as listing visual strength grades, species and timber sources with the strength classes to which each is assigned. The list is not exhaustive, and timber already graded generally cannot be regraded unless the characteristic-value method accounts for the changed population. Machine-graded timber is graded directly into classes, so EN 1912 does not apply to it (SIS page for SS-EN 1912:2024; it replaces EN 1912:2012).
Characteristic values: what a strength class actually promises
The phrase "characteristic value" is easy to misread, so it is worth being precise about what the sources say.
The Napier overview states that the grade-determining properties for normal construction timber are bending strength, bending stiffness and density at 12% reference moisture content. Strength and density are 5th percentile values; stiffness is the mean (Ridley-Ellis, 2018). The Forest Research article on the UK transition to machine grading makes the same point from the producer side: strength class criteria rest on the statistical distribution of a sample, not on individual pieces, and the strength is taken at the ranked 5th percentile value.
Interpretation (mine, not from a source): the 5th percentile means that, in a population of graded boards assigned to, say, C24, no more than about one board in twenty is expected to have a bending strength below 24 MPa. It does not mean that every board reaches 24 MPa. This is why grading is a population statement, and why a single failed test piece does not by itself prove that a batch is mis-graded.
The class designation encodes the bending value. The Polish pine papers put it simply: the class number corresponds to bending strength, and modulus of elasticity and density are the key parameters for machine grading, from which other properties can be derived (Krzosek et al., 2019; Krzosek et al., 2022). So C24 means a 5th percentile bending strength of 24 MPa, with a mean modulus of elasticity of 11 000 MPa and a 5th percentile density of 350 kg/m3 (Stapel, 2014). C30 means 30 MPa, 12 000 MPa and 380 kg/m3 in the same source.
EN 338 strength classes C14 to C50
The table below gives selected values for the softwood classes. It is taken from a page of an Italian design-office website that reproduces "Tabella 15.1 UNI EN 338:2016" (Studio Madera). I could not check it against the standard, but the bending strengths, mean moduli and the densities for C14 to C30 match the values quoted in Stapel's thesis (C24, C30) and in the Silesian pine paper (C14, C18, C24, C30, C50 for bending and mean modulus; see the discrepancy note below). The values are bending strength fm,k (5th percentile), mean modulus of elasticity parallel to grain E0,mean, characteristic density rho_k (5th percentile) and mean density.
| Class | fm,k (MPa) | E0,mean (GPa) | rho_k (kg/m3) | rho_mean (kg/m3) |
|---|---|---|---|---|
| C14 | 14 | 7.0 | 290 | 350 |
| C16 | 16 | 8.0 | 310 | 370 |
| C18 | 18 | 9.0 | 320 | 380 |
| C20 | 20 | 9.5 | 330 | 400 |
| C22 | 22 | 10.0 | 340 | 410 |
| C24 | 24 | 11.0 | 350 | 420 |
| C27 | 27 | 11.5 | 360 | 430 |
| C30 | 30 | 12.0 | 380 | 460 |
| C35 | 35 | 13.0 | 390 | 470 |
| C40 | 40 | 14.0 | 400 | 480 |
| C45 | 45 | 15.0 | 410 | 490 |
| C50 | 50 | 16.0 | 430 (see note) | 520 (see note) |
Discrepancy note. The Silesian pine paper prints an "EN 338:2016, Table 1" extract in which C50 has a characteristic density of 460 and a mean density of 550 kg/m3, and in which C24 tension parallel to grain is 14 MPa and shear strength 2.5 MPa. The design-office page gives 430 and 520 kg/m3 for C50, 14.5 MPa for C24 tension and 4.0 MPa for C24 shear. The bending strengths and mean moduli agree between the two. My reading (an interpretation, not verified) is that the paper's extract reflects an earlier edition of the standard, but I could not confirm that. Because of this conflict I give only bending, stiffness and density here and I flag the C50 density cells. Anyone designing with these numbers should take them from the current standard.
- The Finnish wood information site states that classes C14 to C50 exist, that the most common in Finland are C18, C24, C30, C35 and C40, and that classes C14 to C30 can be sorted visually or mechanically while C35 to C50 are machine-sorted only (Puuinfo, 2020). The Silesian paper agrees in practice: machine grading placed 32.4% of its batch in C40 and C35.
- EN 338:2016 also defines hardwood classes (D30 to D70 according to the Polish papers). The iTeh preview says only that the 2016 edition extended them on the basis of edgewise bending tests, and I found no open table of D-class values, so I give none. The number in the designation is again the characteristic bending strength.
Visual grading
How it works
In visual grading a trained grader inspects each piece and assigns it to a grade according to the size and position of defects. The Finnish Puuinfo page lists what inspectors check: knot count, knot location and quality, cracks, warping and distortion and other faults, and optionally growth ring thickness. A practical consequence is that visual grading is a rule-based decision on characteristics a person can see from the surface. The Silesian paper lists the features a visual standard assesses: knots, grain deviation, cracks, resin and bark pockets, rot, insect tunnels, wane, curvature, twist and mechanical damage (Krzosek et al., 2019). Hernandez and Green (handbook chapter on lumber properties) name the principal growth features as "the size and location of knots, sloping grain, and density", and an Auburn lecture deck adds the mechanism: knots cause stress concentrations and grain deviations cause tension perpendicular to grain.
The features and what limits are typically set
I could not obtain a numeric strength-reduction table for knots or slope of grain from an open source (the US Wood Handbook chapter that contains one was not retrievable). What I can report are the limits used in a real national rule, DIN 4074-1, as reproduced in an Austrian school textbook excerpt that cites "ÖNORM DIN 4074-1" without giving an edition year (HPT, undated). The table is for softwood squared timber (Kanthölzer), with boards and planks graded on edge:
| Feature | S7 | S10 | S13 |
|---|---|---|---|
| Knots (share of cross-section) | up to 3/5 | up to 2/5 | up to 1/5 |
| Slope of grain | up to 16% | up to 12% | up to 7% |
| Pith | permitted | permitted | not permitted (permitted in squared timber wider than 120 mm) |
| Ring width, general | up to 6 mm | up to 6 mm | up to 4 mm |
| Wane | up to 1/3 | up to 1/3 | up to 1/4 |
| Compression wood | up to 3/5 | up to 2/5 | up to 1/5 |
| Ring shake, lightning cracks | not permitted | not permitted | not permitted |
| Brown and white rot | not permitted | not permitted | not permitted |
| Blue stain | permitted | permitted | permitted |
Rate of growth
Ring width is the visual proxy for density and stiffness, and the Polish Scots pine study shows how weak that proxy can be. In a sample of 210 pines (40 x 138 x 3500 mm, Silesia, about 120-year-old trees), the coefficient of determination between ring width and bending strength for the whole batch was only 0.18, with 0.10 for density and 0.17 for modulus of elasticity. It was stronger in the best log quality class (class A: 0.47 for density, 0.88 for MOE, 0.65 for strength) and weaker in poorer logs (class C: 0.04, 0.16 and 0.13). The authors also found a dependence on position in the tree, with the highest correlation for butt logs and the lowest for top logs. Mean ring widths were similar across log classes (1.88, 1.73 and 1.92 mm for A, B and C) while mean bending strength was 61, 54 and 38 MPa (Mankowski et al., 2020): log class said more about strength than ring width did. That is one sample of one species from one region, so I would not generalise it to spruce or to other regions without more evidence.
National rules: Germany, Nordic countries, Poland
Germany: DIN 4074-1. Classes S7, S10 and S13 for softwood, shown above. Stapel reports that the DIN rule set mapped to EN 338 classes in his comparison and uses a knot-area-ratio threshold of tKAR up to 0.16 as a stand-in for C30 in one analysis (that threshold is his analytical choice and not necessarily the wording of DIN).
Nordic countries: INSTA 142. Puuinfo describes INSTA 142 as the pan-Nordic visual sorting standard with classes T0, T1, T2 and T3, which are approved as corresponding to EN 338 classes C14, C18, C24 and C30. Stapel notes that INSTA 142 has four grade classes (excluding reject) and that it is the only standard in his comparison that uses absolute knot values (in millimetres, as opposed to ratios) as a grading criterion. I did not find the numerical knot limits of INSTA 142 in an open source, so I do not quote them. (Stapel's Table 2 lists INSTA T2 and T1 among the grades that correspond to EN 338 classes, while Puuinfo lists T0 to T3. These are not contradictory, but I read only fragments of the thesis.)
Poland: PN-D-94021. The Polish rule sorts into grades KW, KS and KG plus reject. This is verified in two open papers from Warsaw University of Life Sciences (Krzosek et al., 2019; 2022), which cite the 2013 edition, PN-D-94021:2013. The only numeric limits I could confirm are for ring width: a maximum average of 4 mm for KW, 6 mm for KS and 10 mm for KG (Mankowski et al., 2020). Two further points from the same papers: the authors treat C24 as equivalent to KS and C18 as equivalent to KG for comparison purposes, and Mankowski et al. state that the Polish KW, KS and KG grades have not been included in EN 1912. Interpretation: this means that, as of those papers, Polish visual grades could not be used to claim an EN 338 class for CE marking purposes through the EN 1912 route, and the equivalence is a research convention. I did not check whether this has changed with EN 1912:2024.
Do national rules deliver what they declare?
A Holzforschung paper on the efficiency of visual grading with respect to origin, species, cross section and grading rules concludes, in its abstract, that depending on the parameters, the yields or the mechanical properties are low compared with the declared values, and recommends reconsidering the existing limits in EN 1912 for source areas and cross sections. I could read only the abstract. It is a serious caution against assuming that a visual rule transfers unchanged from the region where it was calibrated to timber from elsewhere.
Machine grading
The idea
Machine grading measures one or more indicating properties (IPs) on every piece at line speed and combines them into a predicted strength. The IPs are chosen because they correlate with bending strength. The Silesian paper notes that automated lines can reach feed speeds of up to 200 m/min, and that a machine should grade full-size timber non-destructively with a measured characteristic that correlates with bending strength (Krzosek et al., 2019).
Dynamic MOE and density
The classical machine measures dynamic modulus of elasticity. Stapel describes it as calculated from the longitudinal resonance frequency and the density of the piece, with density obtained from weight and dimensions and corrected for moisture. The Brookhuis MTG used in the Polish studies measures dynamic MOE by the vibration method, using the natural frequency after a short impact (Krzosek et al., 2019; 2022).
How good is it? In the Gradewood data (Ranta-Maunus, Denzler and Stapel, 2011, VTT Working Paper 179), the best grading-machine model for spruce bending had R2 of 0.63 with bending strength, 0.82 with modulus of elasticity and 0.51 with density; for pine bending, 0.67, 0.68 and 0.34. For laboratory frequency-based MOE alone, R2 with spruce bending strength was 0.51, and 0.54 for dynamic MOE computed with density. Olsson and Oscarsson (2017), on a sample of 936 Norway spruce pieces from Sweden, Norway and Finland, found R2 of 0.53 between a dynamic-MOE indicating property and bending strength. These numbers define the ceiling of simple resonance grading: roughly half of the variation in strength is explained, and the rest is the scatter that settings must absorb.
Knots, density and fibre direction: multi-sensor machines
Knots are the main reason that MOE alone is imperfect, because a knot can sharply reduce local strength while hardly changing the average stiffness of a board (an interpretation consistent with the sources, not a quotation). Ranta-Maunus et al. report that the visual knot area ratio (KAR) alone had R2 with strength of 0.31 for spruce bending and 0.40 for pine bending (0.33 and 0.43 in tension), and that the best indicating-property model for bending included a negative KAR coefficient of -36.0 for spruce and -42.0 for pine (units as defined in that report).
The Microtec Goldeneye family, listed in the Napier settings update, uses a laser-based tracheid effect to measure grain angle, with density and, on higher models, longitudinal resonance added. Olsson and Oscarsson's laser-scanning-plus-dynamic-excitation method reached an R2 of 0.69 to 0.70 with bending strength, against 0.53 for dynamic MOE alone. Yield for the single class C24 was 99.5% for all indicating properties; the gain showed in the higher classes: in a C40/C24 double grade, 14.5% C40 with dynamic MOE, 30.3% with the new method and 47.7% for a hypothetical perfect machine. Interpretation: sensor investment pays mainly when you want to sell high classes. For tension, Briggert et al. (967 Norway spruce boards) report R2 of about 0.65 for a laser-plus-excitation indicator against 0.46 for dynamic MOE; X-ray was used there for board density. A French CT log-scanning study (Ravoajanahary et al., 2025; 726,895 logs) measured mean sound-knot diameters of 20 mm in spruce and 34 mm in pine, but did not test grade yields.
Machine control, output control, and how settings are derived
EN 14081-2 offers two systems, according to Stapel. "Machine control" requires extensive initial tests and fixed settings. "Output control" requires less initial testing but more stringent factory production control. Settings in his work were derived by the cost matrix method (Rouger, 1997) as specified in EN 14081-2. Ridley-Ellis adds that machine control is the common method in Europe, with settings determined by prior testing and approved by a CEN task group (CEN/TC 124/WG 2/TG 1), while output control is less common.
A setting is a combination of a machine, a species group, a size range and a set of strength classes with threshold values for the indicating property. The Napier settings update shows how they are published: market and species code, size range, who derived the settings, class combinations in brackets (for example C24/C16 as a double grade), the machine and setting number, and a confidential approved grading report reference. The document refers readers to manufacturers or notified bodies for yields, and Ridley-Ellis states that not all permitted settings have commercially viable yields. In the Gradewood report, for spruce bending, a C24/reject setting used an indicating-property threshold of 21.3 (units as in that report). For C24, French timber yielded close to 100%, but strength requirements were not met for four of seven countries and single-country strength could be up to 10% below the requirement, so country-level analysis is not sufficient.
Visual versus machine: what the yield numbers show
The cleanest open comparison is in Stapel's doctoral thesis, which compiles spruce results from several papers. The table below reproduces the selected rows (percentages of the sample, bending tests, Norway spruce from a mix of Central and Eastern European origins; individual row sample details are not given in the thesis).
| Method | Resulting class shares (%) |
|---|---|
| Visual, BS 4978 | C18 19; C24 61; reject 20 |
| Visual, DIN 4074-1 | C18 28; C24 50; C30 12; reject 10 |
| Visual, INSTA 142 | C14 9; C18 41; C24 27; C30 18; reject 5 |
| Visual, NF B 52-001-1 | C18 37; C24 31; C30 2; reject 30 |
| Visual, tKAR only | C24 79; reject 21 |
| Machine, dynamic MOE | C24 76; C35 16; reject 8 |
| Machine, dynamic MOE and tKAR | C24 49; C35 28; reject 23 |
Stapel's reading is that machine grading generally yields more than visual grading, and he argues that the continued preference for visual grading in Central Europe rests on reasons that do not hold up. Different rules produce very different class mixes from similar wood, which echoes the Holzforschung abstract above. Adding knot information to dynamic MOE moved material into higher classes (28% in C35 instead of 16%) but also raised rejects (23% instead of 8%). Interpretation: yield tables are not "more is better" scoreboards; a high yield from a weak predictor may simply be less safe.
Scots pine, Poland
The two Warsaw studies compared visual grading under PN-D-94021:2013 with MTG machine grading on Scots pine, 40 x 138 mm boards dried to about 12% moisture.
| Sample | Method | Result (% of pieces) |
|---|---|---|
| Greater Poland-Pomerania, n = 150 (2022) | Visual | KW 4.0; KS 11.3; KG 45.3; reject 39.4 |
| Machine | C40 4.0; C35 22.7; C30 27.3; C24 40.7; C18 4.0; reject 1.3 | |
| Silesia, n = 210 (2019) | Visual | KW 19.5; KS 11.4; KG 29.5; reject 39.5 |
| Machine | C40 10.0; C35 22.4; C30 27.6; C24 30.0; C18 7.1; reject 1.4 |
Both samples show a visual reject rate close to 40% and a machine reject rate around 1%. An earlier study cited in the 2022 paper (Krzosek, 2009) reported visual rejects of up to 52.9%, 4.4% reaching KW, and 17.5% machine rejects for the same batch. The sources contain small inconsistencies (the 2022 text mentions one machine reject while its table shows two, one of them an ERROR; the 2019 machine counts sum to 207, not 210, the missing three being unclassified). I report the table values.
Typical yields for spruce and pine: what can and cannot be said
"What yield of C24 do I get from spruce?" has no single honest answer, as the open sources show.
- For Norway spruce, a single-class C24 grade on a good multi-sensor machine reached 99.5% yield on a Nordic sample of 936 pieces (Olsson and Oscarsson, 2017). Under visual rules, the C24 share in Stapel's compilation ranged from 27% (INSTA 142, with 41% in C18 and 18% in C30) to 61% (BS 4978).
- For pine, Polish MTG results put 27 to 28% in C30 and 40.7% or 30.0% in C24 in the two samples, with 27% and 32% in C35 and C40 together (Krzosek et al., 2019; 2022).
- Between regions, mean bending strength of spruce in the Gradewood data ranged from 34.8 MPa (Slovakia) and 35.5 MPa (Romania) to 43.7 MPa (Slovenia), with Sweden at 42.5 MPa and Poland at 38.5 MPa, and mean density from 387 kg/m3 (Romania) to 445 kg/m3 (Slovenia). For pine, mean bending strength was 44.7 MPa in Sweden and 39.2 MPa in Poland, with mean density of 481 and 516 kg/m3. The report concludes that for pine strength is 10% higher in the North while modulus of elasticity and density are higher in Central Europe, and that Slovak, Romanian and Ukrainian spruce is clearly below the Central European reference.
- Dimension matters. A 2003 Lithuanian study of small pine and spruce boards (Baltrusaitis and Pranckeviciene) found that thickness had a larger effect on the grade distribution than width (the share of the special structural grade fell for thicker boards), and the UK settings are published by size range.
What I did not find in any open source is a representative industrial yield table for a specific mill's spruce or pine by strength class. The UK documents explicitly state that yields are confidential and held by manufacturers and notified bodies. Any figure quoted for "typical" yield should therefore be treated as sample-specific. Yields depend on species group, origin, cross-section, method and settings; a mill's own grading data and type-testing report are the safest guide.
Moisture and the reference condition
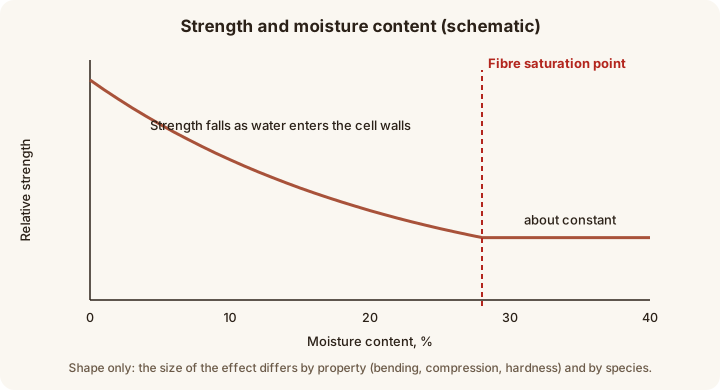
Characteristic values in the EN 338 system refer to a reference moisture content of 12% (the Napier overview gives density and the other grade-determining properties at 12% reference moisture content), so any grading measurement taken at a different moisture content has to be corrected. Stapel describes correcting dynamic MOE to 12% using oven-dry sample measurements under EN 13183-1. For dry-graded timber, EN 14081-1 limits mean moisture content to 20% at grading with no individual reading above 24%, per the iTeh preview. DIN 4074-1 in the HPT excerpt says that limits for shrinkage cracks, bow and twist are disregarded for timber that is not dry-graded.
Factory production control and CE marking
Grading is not complete when a grader or machine assigns a class; the producer must prove it does so consistently. In the EU, solid structural timber falls under the Construction Products Regulation, and EN 14081-1 is the harmonised standard that carries the link (Annex ZA). A guidance note by Robinson and Davis for COFORD in Ireland (2016) summarises the practical regime:
- Solid timber products such as floor joists or cut rafters can be CE marked without the manufacturer taking design responsibility. The manufacturer declares compliance with the harmonised standard and gives the essential characteristics, such as strength class, so a third party can design with them.
- In the authors' wording, most structural timber products have an assessment and verification of constancy of performance level of 2+. At level 2+ the manufacturer must first set up and run a factory production control (FPC) system, which a notified body assesses and approves, and then undergoes regular surveillance audits.
- The notified body usually issues a certificate of conformity of the FPC, and the number is generally needed for the declaration of performance and the CE marking.
- The manufacturer prepares a declaration of performance (DoP) before applying the CE mark. A generic DoP can be placed on a website, should not be altered once uploaded and should remain accessible for at least 10 years after the product is placed on the market.
Sources used
Pages below were opened on 2026-10-26; URLs are in the structured source list. Standards were seen only through publisher previews (items 1 to 3).
- iTeh preview, SIST EN 338:2016 (scope, characteristic values)
- iTeh preview, SIST EN 14081-1:2016 (scope, structure, moisture limits)
- SIS, SS-EN 1912:2024 (assignment of visual grades to classes)
- Studio Madera, reproduction of UNI EN 338:2016 class tables
- Puuinfo (Finland), Sorting sawn timber in terms of strength
- Stapel P., Strength grading of timber with regard to different grading methods, TU Munich doctoral thesis
- Ranta-Maunus A., Denzler J.K., Stapel P., Strength of European timber, Part 2, VTT Working Papers 179 (2011)
- Krzosek S. et al., Scots pine, Greater Poland-Pomerania (Ann. WULS-SGGW No. 119, 2022)
- Krzosek S. et al., Scots pine, Silesia (Ann. WULS-SGGW No. 107, 2019)
- Mankowski P. et al., Influence of pine growth rings width on strength properties, BioResources 15(3), 2020
- HPT (Austria), Sortiermerkmale Nadelholz, DIN 4074-1 textbook excerpt
- Olsson A., Oscarsson J., Strength grading on the basis of high resolution laser scanning and dynamic excitation, Eur. J. Wood Wood Prod. 75 (2017)
- Briggert A., Olsson A., Oscarsson J., Prediction of tensile strength in sawn timber by surface laser scanning and dynamic excitation, Linnaeus University
- Ravoajanahary T. et al., X-ray scanner across 700,000 sawlogs, Forests 16, 1457 (2025)
- Ridley-Ellis D., Strength grading of timber in the UK in 2018, Edinburgh Napier University
- Edinburgh Napier CWST, UK and Ireland grading settings update, 2 May 2024
- Forest Research (UK), strength grading and European standards
- Robinson B., Davis B., Construction Products Regulation: DoP and CE marking, COFORD (2016)
- Efficiency of visual strength grading of timber with respect to origin, species, cross section and grading rules, Holzforschung (abstract only)
- Baltrusaitis A., Pranckeviciene V., Strength grading of the structural timber, Materials Science 9(3), 2003
- Hernandez R., Green D.W., Properties of lumber products (USDA Forest Service Treesearch)
- Auburn University, Wood as an Engineering Material (lecture slides)
- Edinburgh Napier repository, The future of quality control for wood and wood products (COST Action E53 final conference)
Limits of this article
- I could not read the paywalled texts of EN 14081-1 to -4, EN 338, EN 384, EN 408, EN 1912, DIN 4074-1, INSTA 142 or PN-D-94021; statements about them rely on publisher previews, secondary reproductions and papers that cite them.
- The class table reproduces a secondary website and is limited to bending, mean stiffness and density; two sources disagree on some EN 338 values (C50 density, C24 tension and shear). Check the current standard before design use.
- DIN 4074-1 limits come from an educational excerpt without edition year; INSTA 142 knot limits and most PN-D-94021 limits (beyond ring width) were not found; no D-class values were found.
- No numeric strength-reduction factors for knots, slope of grain or wane were available from an opened open source.
- UNECE and COST Action E55 material was not opened; COST Action E53 is cited only via a proceedings summary page. The Holzforschung paper was read as an abstract only.
- Yields are sample-specific research results, not industry averages; industrial settings and yields are confidential. Interpretations are labelled and are mine; the two diagrams are illustrative and no number is drawn from them.
How this text was checked · checked 2026-10-26
Each source page was opened one at a time with WebFetch; all numbers were taken from the opened text. EN standards were read only via publisher previews or secondary reproductions. Interpretations are labelled in the text.
Could not be verified
- Full texts of EN 14081-1 to -4, EN 338, EN 384, EN 408, EN 1912, DIN 4074-1, INSTA 142 and PN-D-94021 were not read (paywalled).
- EN 338 table values come from a secondary design-office page; a Silesian paper prints different values for C50 density, C24 tension and shear, unresolved (probably an older edition, unconfirmed).
- No open D-class (hardwood) values found; none given.
- INSTA 142 numeric knot limits and PN-D-94021 limits other than ring width (4/6/10 mm) not found.
- DIN 4074-1 limits come from an Austrian textbook excerpt without edition year; bow and twist values not usable.
- No numeric strength-reduction factors for knots, slope of grain or wane from an open source (Wood Handbook chapter not retrievable).
- UNECE and COST E55 material not opened; COST E53 cited via proceedings summary only.
- Holzforschung visual-grading efficiency paper read as abstract only.
- Yields are sample-specific research results; no representative industrial yield table found; EN 1912 status of Polish grades after 2024 not checked.
- CE marking guidance (COFORD 2016) predates publication of EN 14081-1:2016 in the OJEU; current details not checked.
Sources
- EN 338:2016 scope and characteristic values (iTeh preview)
- EN 14081-1:2016 scope and structure (iTeh preview)
- SS-EN 1912:2024 (SIS)
- Studio Madera: UNI EN 338:2016 class tables
- Puuinfo: Sorting sawn timber in terms of strength
- Stapel: Strength grading of timber with regard to different grading methods (TUM thesis)
- Ranta-Maunus, Denzler, Stapel: Strength of European timber, Part 2 (VTT WP 179)
- Krzosek et al. 2022: Scots pine, Greater Poland-Pomerania
- Krzosek et al. 2019: Scots pine, Silesia
- Mankowski et al. 2020: Pine growth ring width and strength (BioResources)
- HPT: Sortiermerkmale Nadelholz (DIN 4074-1 excerpt)
- Olsson, Oscarsson 2017: Laser scanning and dynamic excitation grading
- Briggert, Olsson, Oscarsson: Tensile strength prediction by laser scanning
- Ravoajanahary et al. 2025: Industrial X-ray scanner on 700,000 sawlogs (Forests)
- Ridley-Ellis 2018: Strength grading of timber in the UK in 2018
- Edinburgh Napier: UK and Ireland grading settings update 2024
- Forest Research UK: strength grading and European standards
- Robinson, Davis 2016: CPR, DoP and CE marking (COFORD)
- Holzforschung: Efficiency of visual strength grading (abstract)
- Baltrusaitis, Pranckeviciene 2003: Strength grading of the structural timber
- Hernandez, Green: Properties of lumber products (Treesearch)
- Auburn University: Wood as an Engineering Material (slides)
- Edinburgh Napier repository: COST Action E53 final conference proceedings
Last updated 2026-10-26